
How Images Impact Amazon Listing Performance
Last Updated: August 2025
When sellers try to improve their Amazon results, most of them focus on keywords, reviews, or pricing.
But there’s something more immediate — and often more powerful — that drives whether a shopper clicks, scrolls, or buys:
The images.
Over the past few months, I’ve worked closely with brands and agencies across dozens of categories. Whether they’re launching a new SKU or optimizing an existing listing, one pattern is consistent:
Images play a bigger role in Amazon listing performance than most people realize.
To prove it, we pulled together 3 simple charts based on real data and real shopper behavior.
Better Main Images = Better Performance
Each of the following sections breaks down a specific insight — supported by real numbers — that reveals how your visuals directly impact your performance on Amazon.
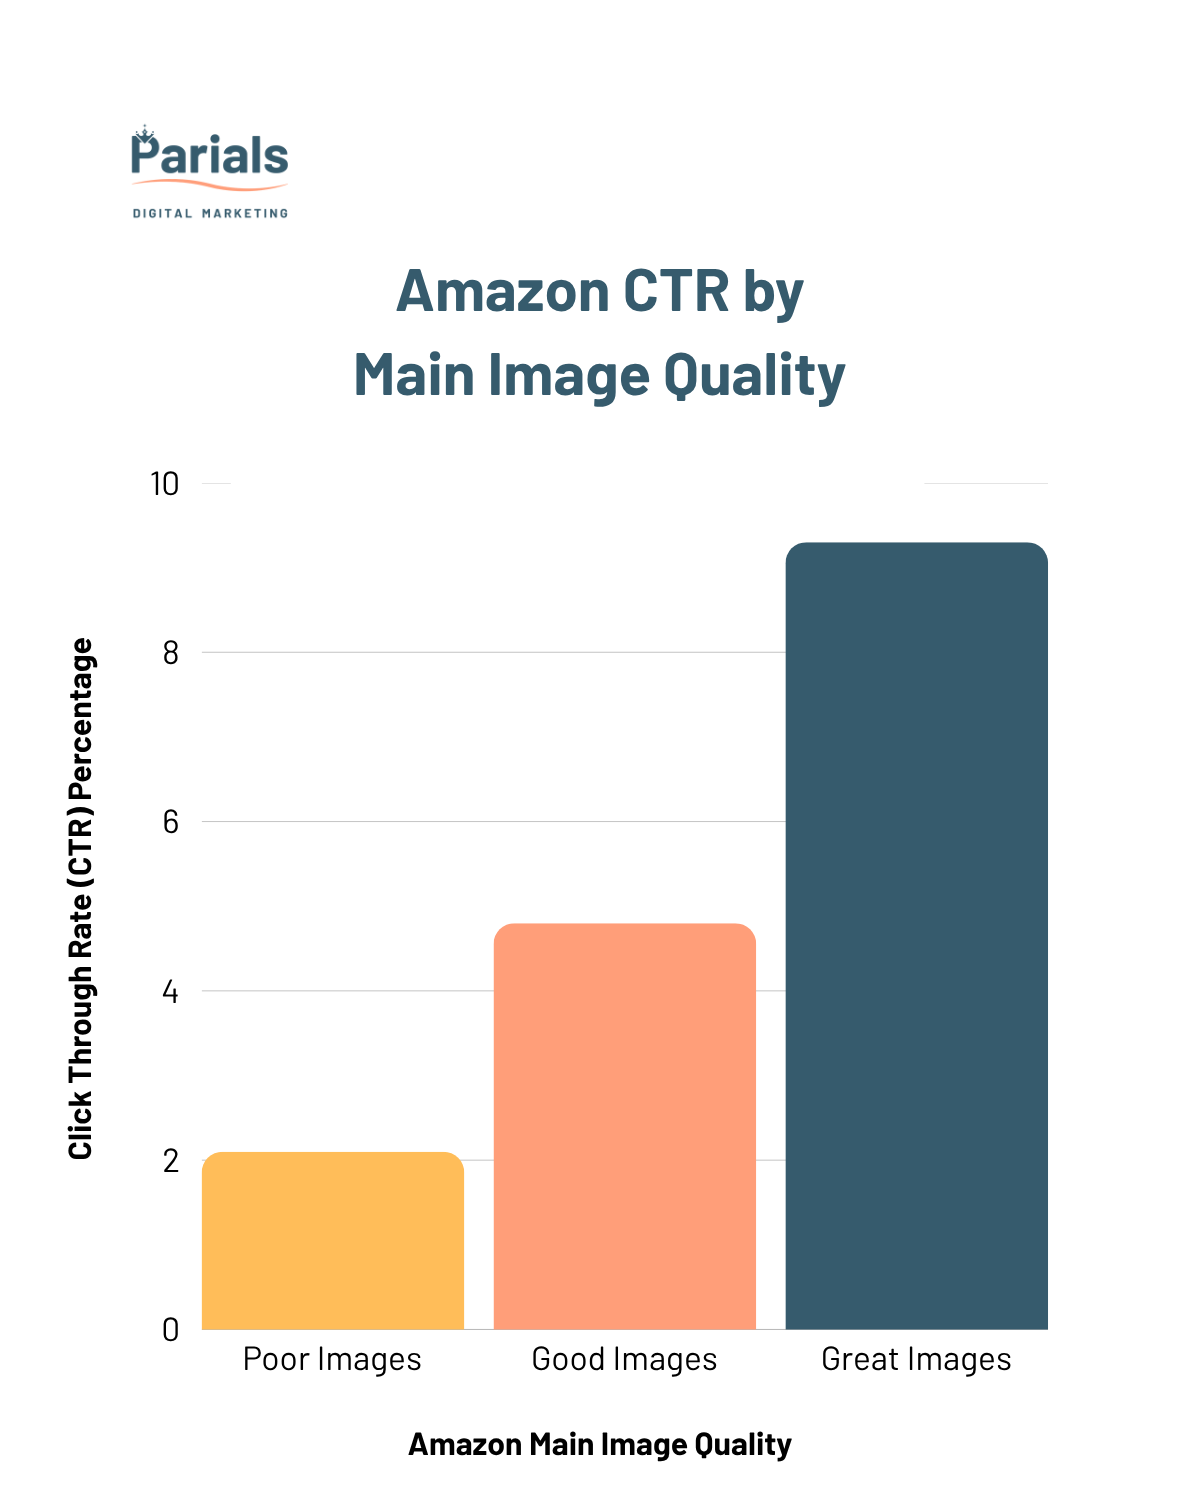
A bar chart showing how higher-quality main images lead to significantly better click-through rates.
High-Quality Main Images Drive More Clicks
Your main image is the first — and sometimes only — thing a shopper sees in search results. Think of it like your product's billboard. If it doesn’t grab attention, it doesn’t get clicked.
In our first chart, we compared click-through rates (CTR) across three categories of image quality:
Poor (low-res, cluttered, unclear background)
Standard (readable but uninspiring)
Optimized (clean, sharp, professionally styled)
Listings with optimized main images achieved over 9% CTR, while poor images struggled around 2%.
That’s more than 4x the traffic — simply by improving the first image.
A strong main image isn’t about looking pretty. It’s about earning the click — which is the first step to improving Amazon listing performance.
Not sure if your images are helping or hurting your Amazon listing?
We’ll send you a free report outlining what’s working
— and what’s missing.

An area chart showing that shoppers spend the most time viewing product images over any other part of a listing.
Shoppers Spend Most of Their Time on Images
You might spend hours fine-tuning your bullet points and A+ content, but the reality is:
Shoppers spend the majority of their time in the image gallery.
According to our second chart, here’s the average time spent on each section of a listing:
Images: 7.5 seconds
Title: 3.2 seconds
Bullets: 2.7 seconds
A+ Content: 1.6 seconds
Price: 1.2 seconds
Reviews/Q&A: 0.8 seconds
In total, over 60% of the time on a product page is spent viewing images.
If your images aren't telling the story, building trust, and addressing key objections — you're missing the most valuable real estate in your listing.
This is why visuals are foundational to your Amazon listing. They’re not just supporting your message — they are the message.
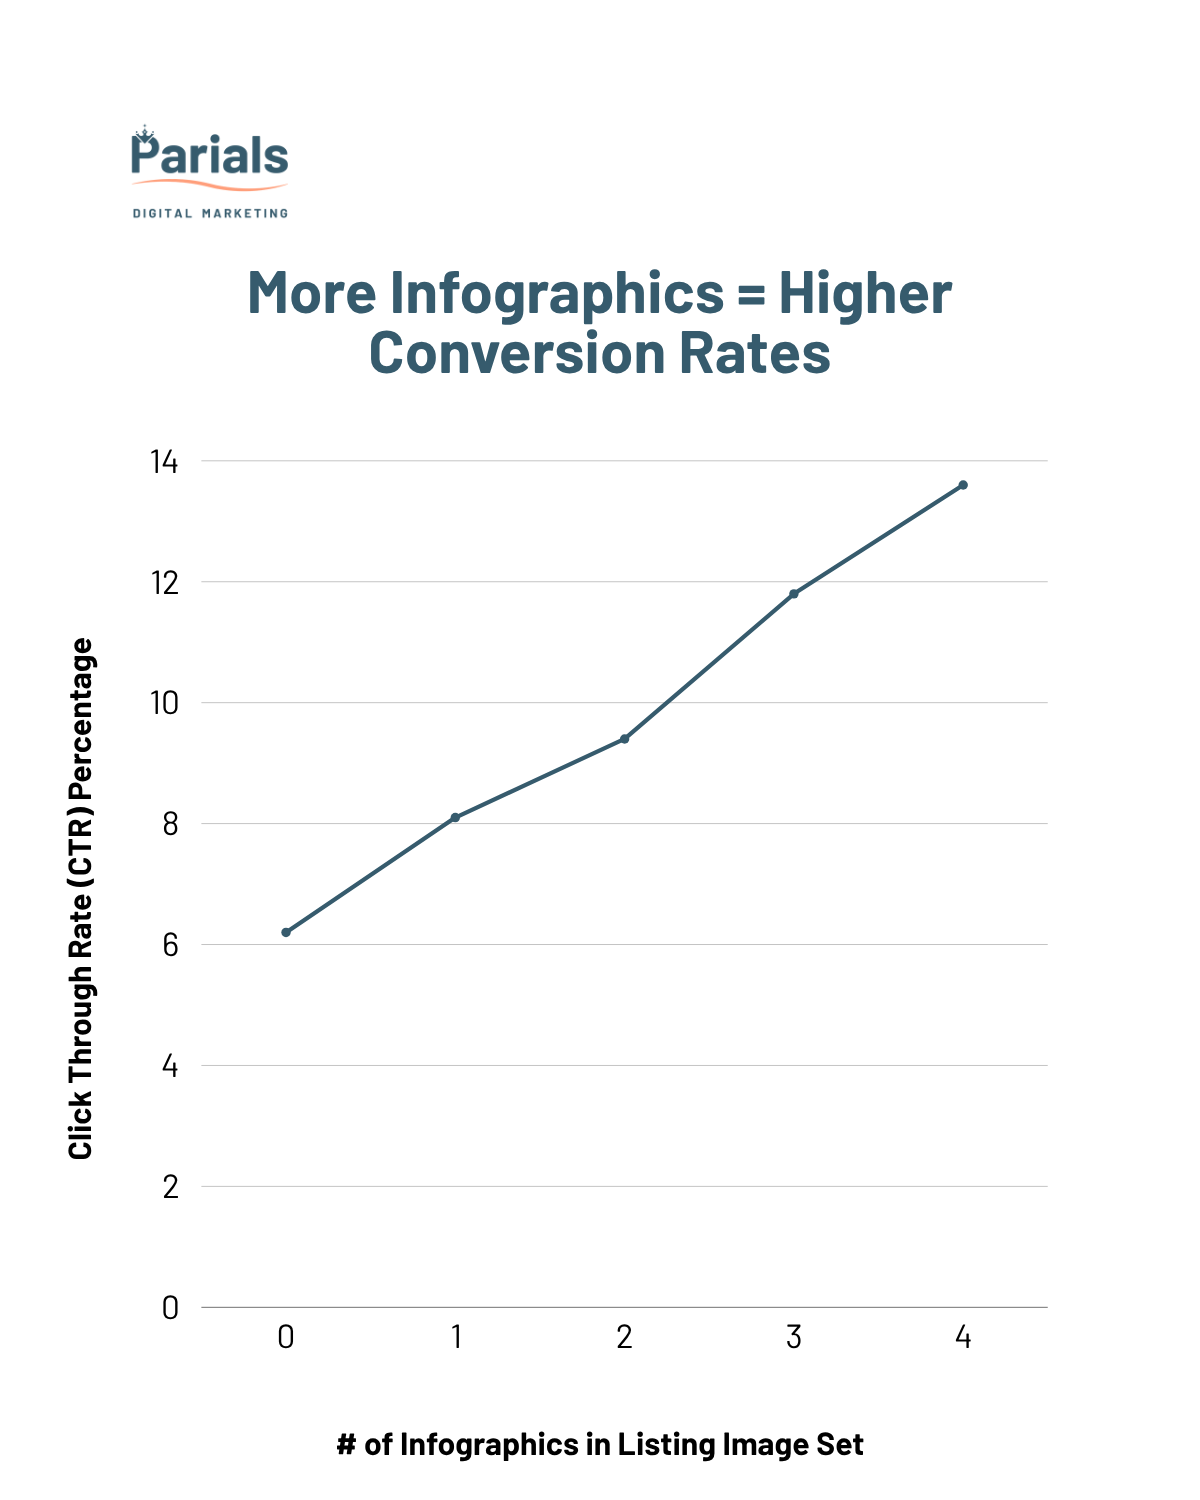
A line chart illustrating how listings with more infographic-style images convert at a higher rate than those without.
Infographics Boost Conversion Rates
Once you’ve earned the click and captured attention, it’s time to close the sale.
And here’s where infographics shine.
In our third chart, we measured conversion rate increases based on how many infographic-style images were used in a listing:
0 infographics = ~6.2% conversion
1 infographic = ~8.1% conversion
2 infographics = ~8.7% conversion
3 infographics = ~11.8% conversion
4+ infographics = ~13.6% conversion
That’s more than double the conversions simply by using visuals that clearly explain the product’s benefits, use cases, or features.
Infographics build clarity — and clarity builds confidence.
If you want to turn browsers into buyers, your images need to answer the questions shoppers haven’t even asked yet.
Know it’s time to upgrade your visuals?
Book a quick call with Parials Digital Marketing and get a personalized quote for image sets, infographics, or full listing design.
Ready to Improve Your Amazon Listing Performance?
You don’t need to guess what’s holding your listing back — the data makes it clear:
Better main images bring more traffic
A great image gallery keeps shoppers engaged
Infographics increase conversions
At Parials Digital Marketing, we specialize in helping Amazon sellers and agencies turn underperforming listings into high-converting, on-brand product experiences — one image at a time.
Parials Digital Marketing is an Amazon design agency helping brands create designs that makes them standout through listing images, A+ content, product photography, and Store design. Based in Kitsap County, WA, serving sellers nationwide.